
How to Choose a Neighborhood You Will Love (and Can Afford)
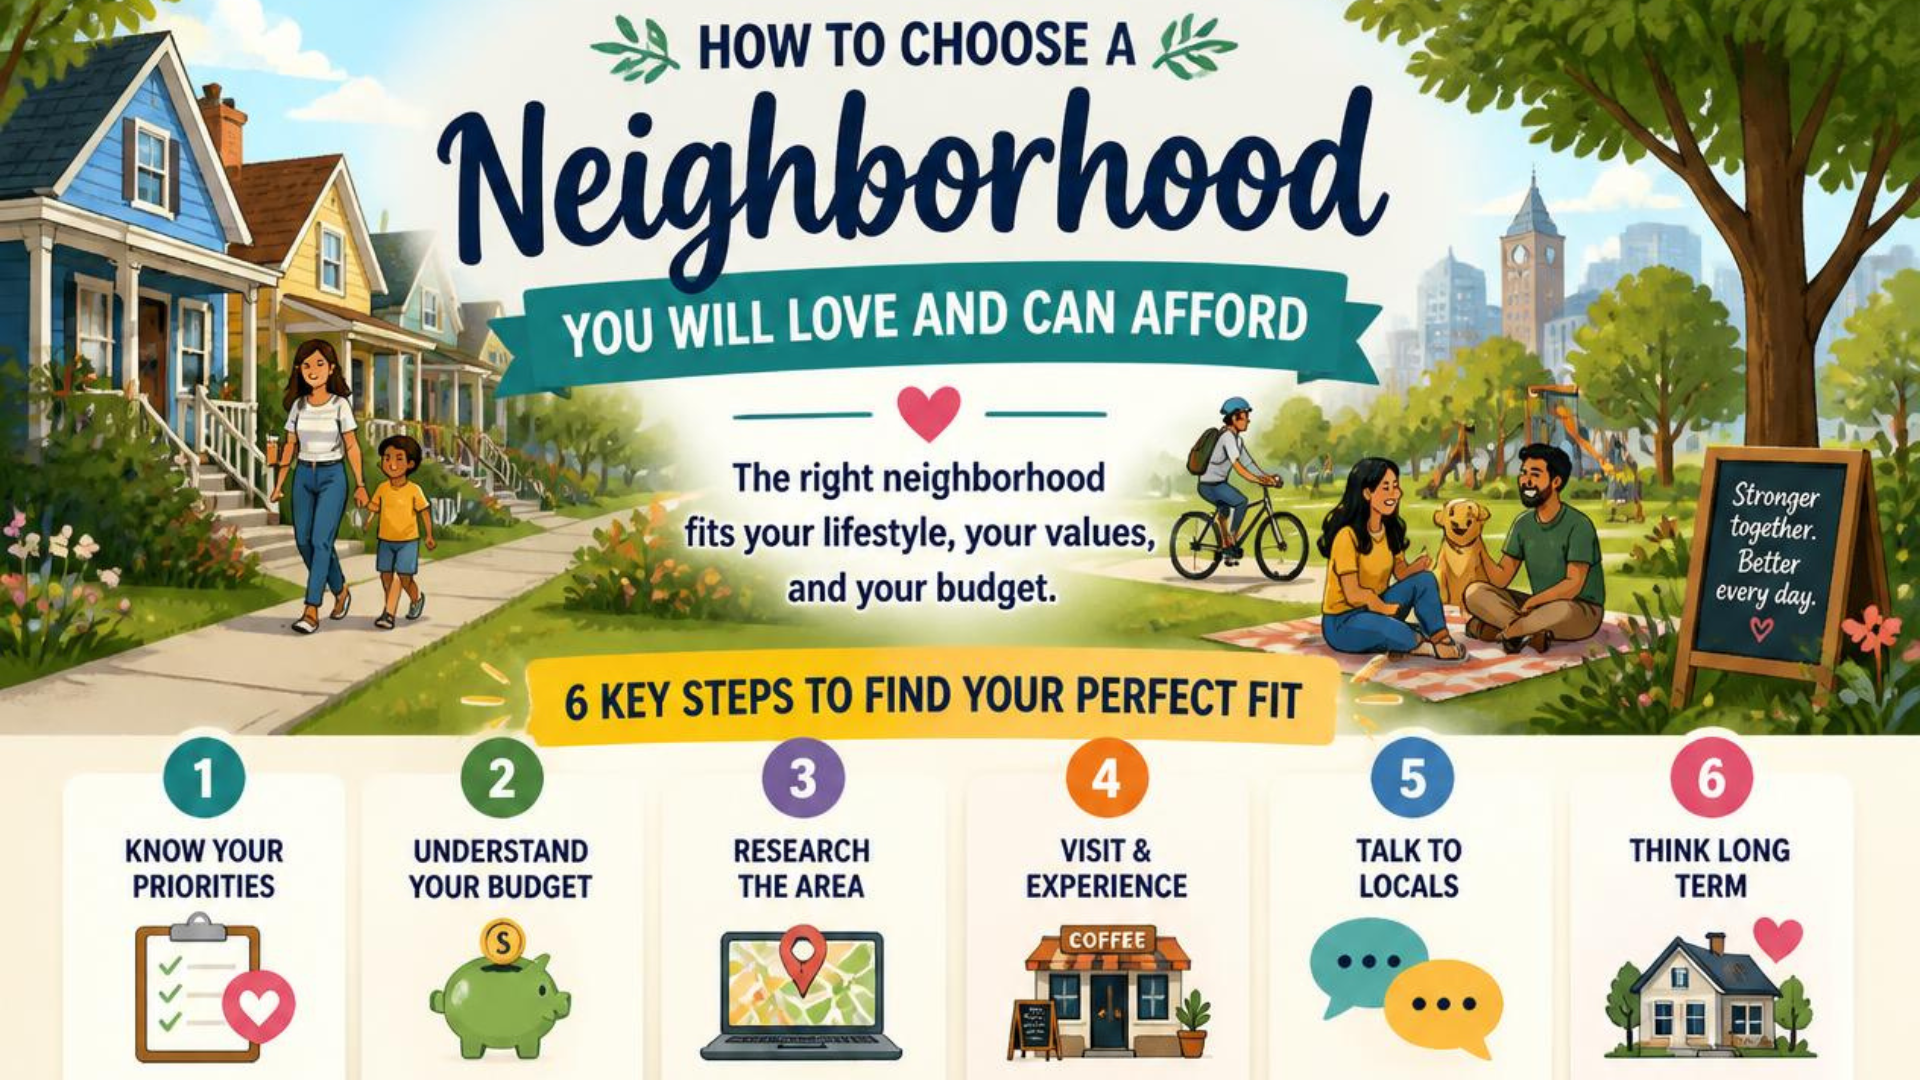
Selecting a residential location is a complex transaction that goes far beyond acquiring a physical structure. A home is a bundle of localized economic, regulatory, social, and spatial factors. Historically, home buyers evaluated options through a narrow lens, focusing primarily on property prices and basic home configurations. However, modern spatial analysis shows that long-term asset appreciation, personal financial solvency, and overall well-being are heavily dictated by the surrounding neighborhood.
In fact, empirical surveys show that a high percentage of buyers fall victim to location regret. According to data from Motley Fool Money, 25% of all homeowners express buyer’s remorse. This rate escalates dramatically based on generation: 64% of millennial buyers (ages 25-40) report remorse, compared to only 33% of baby boomers. This gap is often driven by buyers making offers under intense pressure, purchasing sight unseen, or waiving home inspection contingencies.
To prevent location-induced regret, this workbook-style guide provides a structured, data-driven framework to help you evaluate and choose a neighborhood you will love, and can actually afford.
1. The Lifestyle Priority Matrix (Cost, Comfort, and Fun)
Evaluating potential neighborhoods involves comparing diverse, often conflicting variables, such as urban density versus suburban square footage. Simple pros-and-cons lists fail to capture the unequal importance of different criteria.
To eliminate subjective bias and reduce cognitive overload, senior investment analysts use a weighted scoring decision matrix. This matrix translates qualitative lifestyle desires into a structured, measurable scoring system.
- Select Your Drivers: Choose four to eight high-impact criteria to avoid over-engineering your decision. Group them around three core pillars: cost, comfort, and fun.
- Assign Weights: Allocate a percentage of importance to each criterion (e.g., School Quality = 20%, Commute Efficiency = 25%, Walkability = 15%). The total must equal 100%.
- Apply an Uncertainty Discount: To account for unverified details, like a projected neighborhood rezoning or an unconfirmed park development, apply a "risk discount" of 20% to 50% to that neighborhood's score in that category.
- Validate for Strategic Alignment: Once the math is done, cross-check the results with your gut feeling. Ask yourself reflective questions about your long-term identity and values: Do I actually want to become the kind of person who lives in this specific environment day in and day out?
2. Decoupling the "True" Cost of a Commute
A foundational error in homebuying is relying on the traditional "30% affordability rule". This outdated metric focuses strictly on mortgage or rent payments relative to gross income, completely neglecting the massive operational costs of where your home is physically located.
Modern real estate economics proves that the true cost of a home is a combined bundle of housing, transportation, energy, and insurance, which frequently consumes 50% to 60% of a household's net income.
[ True Monthly Housing Cost ] = Base Home Payment + Financial Commute Costs + Time Commute Costs
Households often move further from urban employment centers to secure a lower sticker price, inadvertently trading fixed housing costs for highly volatile, recurring transportation expenses.
- The Second-Largest Expense: Transportation represents the second-largest household budget item. On average, U.S. households spend $1,110 per month (17% of their budget) on transit.
- The True Commuter Cost: When you factor in fuel, insurance, financing, routine maintenance, and vehicle depreciation, the average annual commuting cost for a single worker commuting alone by car exceeds $8,000.
- The Hidden "Time" Cost: A longer commute costs time, which carries real value even if it never shows up on a bank statement. Saving 30 minutes each way on a commute yields 24 hours of reclaimed free time every single month. When valued against a professional hourly wage, paying more to live closer to work is almost always the smarter financial and psychological decision.
3. Hyperlocal Vibe Audits: Navigating Community Micro-Cultures
Neighborhood micro-cultures can range from active-outdoors and historic-walkable nodes to quiet suburban cul-de-sacs and high-density transit corridors. Rather than relying on a seller's brochure or anecdotal gossip, use specialized data platforms to audit a community’s daily vibe:
- AreaVibes: Aggregates demographic and municipal data into a single "Livability Score" based on seven distinct categories, including local amenities, cost of living, crime rates, employment, and schools.
- NeighborhoodScout: Provides predictive, micro-neighborhood trends, localized crime mapping, and details about the housing mix of homeowners versus renters.
- EPA National Walkability Index: Ranks every U.S. Census block group on a 1-to-20 scale based on street design, sidewalk completeness, intersection density, and public transit proximity.
- Safety Mapping: Use geolocated databases like CrimeMapping.com and ADT Crime Maps to review public incident reports and safety trends directly on a map.
4. The Association and Fiscal Health Audit
If you are purchasing a property in a common-interest development governed by a Homeowners Association (HOA), you are essentially joining a mini-government with the power to charge fees, restrict your lifestyle, and place liens on your home. You must thoroughly audit the HOA's financial health before closing to protect yourself from sudden, budget-crushing cost increases.
- Demand the Reserve Study: The reserve study is a 20-to-30-year financial projection of the association’s long-term capital replacement costs (like roofs, elevators, and paving).
- Check the "Percent-Funded" Metric: This measures how much cash the HOA has in reserve versus the estimated depreciation of its physical assets. A funding level of 70% or above is healthy, under 50% is concerning, and under 30% is a critical financial risk.
- The Threat of Special Assessments: When an HOA’s reserves are depleted, the board will levy a "special assessment", a mandatory, legally binding lump-sum charge split among all homeowners to fund emergency repairs. A disorganized or underfunded HOA can easily hit you with a sudden special assessment ranging from $10,000 to over $35,000 shortly after you move in.
- Audit the Meeting Minutes: Request the last 12 to 24 months of HOA board meeting minutes. This is where the board discusses deferred maintenance, rising insurance premiums, or potential special assessments long before they are officially declared.
5. Future Development: Is the Neighborhood Permanent?
A common and costly mistake is assuming a neighborhood’s current layout is permanent. Local land-use regulations are constantly evolving, and you must audit them to avoid buying next to a future commercial zone or highway construction project.
- Zoning Maps vs. Future Land Use Maps (FLUM): The Zoning Map reflects what is legally allowed on a property today. The Future Land Use Map is an aspirational policy document that shows where the city intends to allow denser housing or commercial growth over the next 10 to 20 years. If a quiet, vacant field next to your target home is zoned "Agricultural" today but designated as "High-Density Commercial" on the FLUM, a commercial retail center or strip mall is highly likely to be built there in the future.
- Decode Zoning Map Colors: Standard maps use yellow-to-brown for residential areas (darker shades indicate higher density, like apartments), orange-to-red for commercial intensity, gray-to-purple for industrial uses, blue for public buildings/schools, and green for parks.
- Audit the Capital Improvement Plan (CIP): The municipal CIP is a multi-year budget listing planned public infrastructure investments over a 4-to-10-year horizon. Reviewing the CIP helps you identify up-and-coming areas slated for public parks and transit upgrades, while highlighting zones destined for heavy municipal construction and road expansions.
6. The School District Premium: Your Resale Moat
Public school performance is a primary driver of residential real estate valuation and long-term capital preservation, even if you do not have children.
- The Capitalization Loop: Research from the National Bureau of Economic Research reveals that every single dollar spent on public schools within a community increases surrounding home values by $20. Excellent schools attract affluent buyers, driving up home values, which expands the local property tax base and further funds the school system.
- The Pricing Premium: Homes in highly rated school districts command premiums of 10% to 20% over comparable properties in average districts, climbing to 49% or higher in highly competitive, supply-constrained markets. Furthermore, a 5% increase in standardized test scores is directly linked to a 2.5% increase in local home values.
- Market Velocity and Recession Proofing: Properties in strong school districts sell an average of eight days faster than those in lower-performing areas. More importantly, they act as defensive assets: during economic recessions, homes in top-tier school districts hold their value, experiencing significantly smaller price drops than homes in lower-rated districts.
7. The Multi-Time Walk Audit
While digital datasets provide a solid baseline, they must be augmented by an on-site, boots-on-the-ground walk audit of your target street. Neighborhood traffic, parking, noise, and safety dynamics shift drastically depending on the day of the week and the hour of the day.
Design a walk audit of a half-mile out and a half-mile back (a 1-mile round-trip route) and visit during these distinct windows:
- Morning Commute (Tuesday/Wednesday, 7:30 AM – 8:30 AM): Observe commuter traffic velocity, street parking congestion, sidewalk safety, and kids walking to school.
- Afternoon Dismissal (Monday/Friday, 3:00 PM – 4:00 PM): Check local school traffic bottlenecks, pedestrian crossing safety, and compliance with residential speed limits.
- Evening Transition (Friday/Saturday, 8:30 PM – 9:30 PM): Assess street lighting quality. Rule of thumb: Street lighting should be consistent, and you should be able to clearly identify a face from 25 meters (75 feet) away. Note local commercial noise, parking demands, and overall security.
- Weekend Serenity (Sunday, 9:00 AM – 10:30 AM): Observe recreational activity, social interactions, pet-walking frequency, and the general level of home and lawn maintenance.
By utilizing this structured framework, you can elevate your home search from an emotional, high-stress guessing game into a highly logical, data-driven investment decision, protecting both your capital and your long-term peace of mind.